sc_toolbox.plot.annotated_cell_type_umap#
- sc_toolbox.plot.annotated_cell_type_umap(adata, primary_color, cell_type_color, legend_loc='on data', legend_fontsize=8, title='Plot title', palette=None, cmap=None, figsize=(8, 6), save=None)[source]#
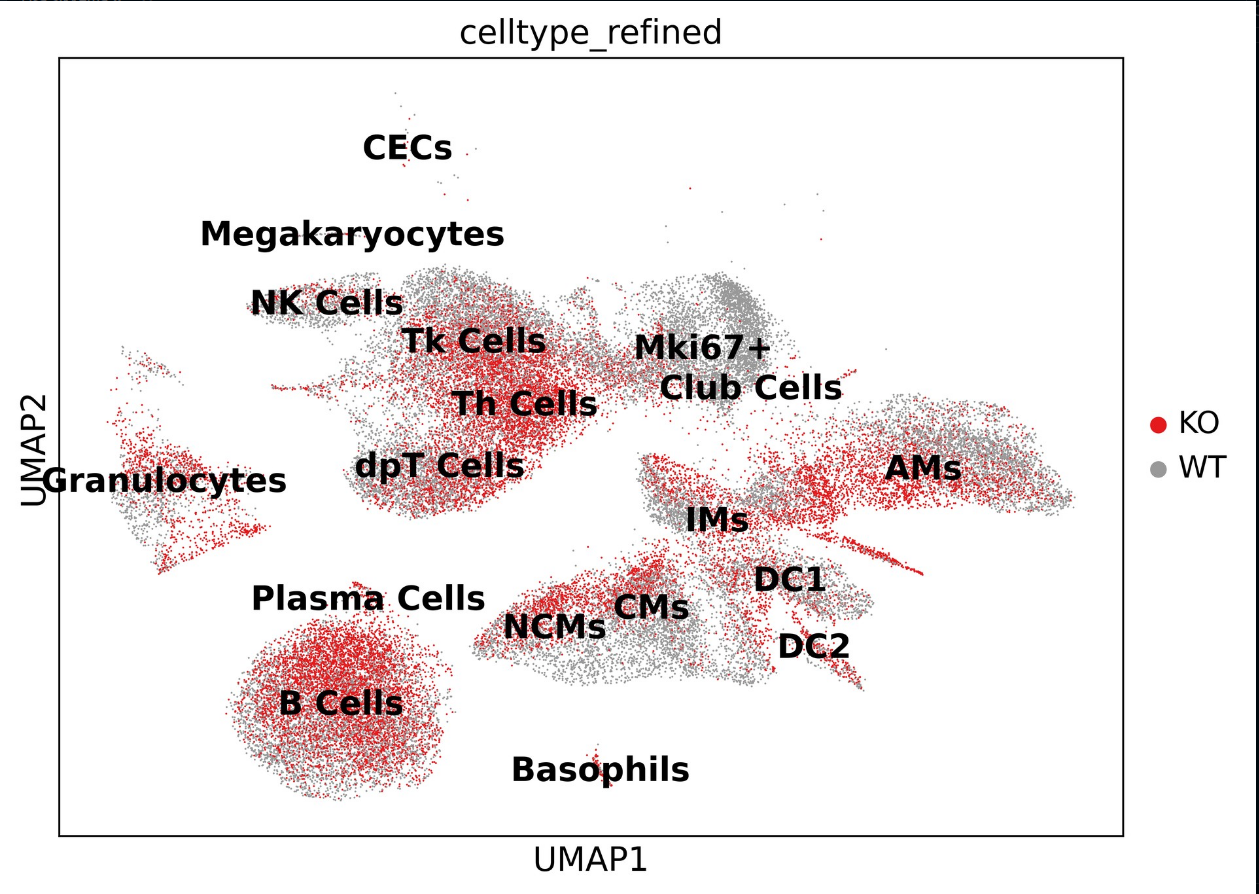
Plots a UMAP which is colored by the primary_color, but also draws all labels on top of all clusters.
- Parameters:
adata – AnnData object
primary_color (
Union[str,Sequence[str]]) – Primary color to color all cells by, e.g. ‘genotype’cell_type_color (
str) – Key containing all cell types, e.g. ‘cell_type’legend_loc (
str) – Location of the legend (default: ‘on data’)legend_fontsize (
int) – Font size of the legend (default: 8)title (
str) – Title of the plotpalette – Color
cmap – Color map of the UMAP
figsize – Size of the figure
save – Path to save the plot to
- Returns:
fig and axs Matplotlib objects
Example