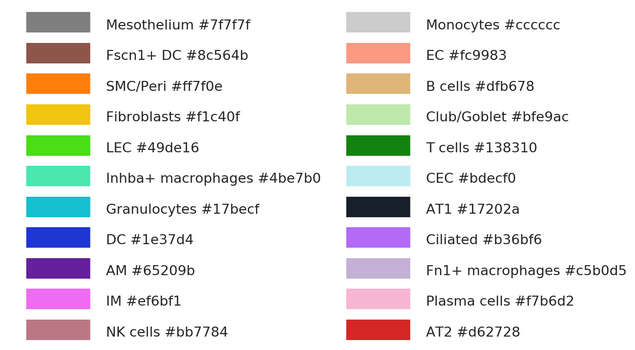
sc_toolbox.plot.colors_overview# sc_toolbox.plot.colors_overview(colors, ncols=2, figsize=(8, 5), save=None)[source]# Draw an overview plot of all used colors. Parameters: colors (Dict) – Dictionary of color name and color ncols (int) – How many columns for the plot figsize (Tuple[int, int]) – Size of the figure as specified in matplotlib save (Optional[str]) – Path to save the plot to Example