sc_toolbox.plot.relative_frequencies_lineplot#
- sc_toolbox.plot.relative_frequencies_lineplot(relative_frequencies, order, cluster, xlabel='days', ylabel='relative frequency', hue=None, smooth=None, cols=None, title=None, rotation=None, figsize=(15, 5), tick_size=None, label_size=None, order_smooth=3, conf_int=None, scatter=None, save=None)[source]#
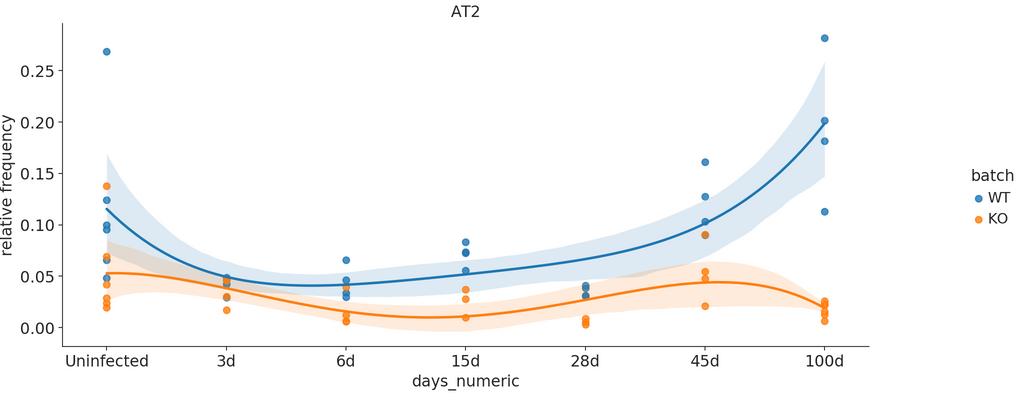
Plot relative frequencies as a line plot.
- Parameters:
relative_frequencies (
DataFrame) – Data frame containing relative Frequencies as calculated by calc_relFreq()order – Order of x-axis labels from left to right
cluster – Which cluster to plot
xlabel (
str) – x-axis labelylabel (
str) – y-axis labelcols – List of colors to use for line plot
figsize (
Tuple[int,int]) – Size of the figure as specified in matplotlibtick_size (
Optional[int]) – Size of the ticks as specified in matplotliblabel_size (
Optional[int]) – Size of the labels as specified in matplotliborder_smooth (
int) – If greater than 1, numpy.polyfit is used to estimate a polynomial regressionconf_int – Size of the confidence interval for the regression estimate
scatter – Set to True to add average expression values per sample ID as dots
Example