sc_toolbox.plot.gene_boxplot#

sc_toolbox.plot.gene_boxplot(table, palette, xlabel='cell_types', hue=None, figsize=(10, 5), legend=True, score='Axin2', scatter=None, rotate=False, width=0.7, save=None)[source]#

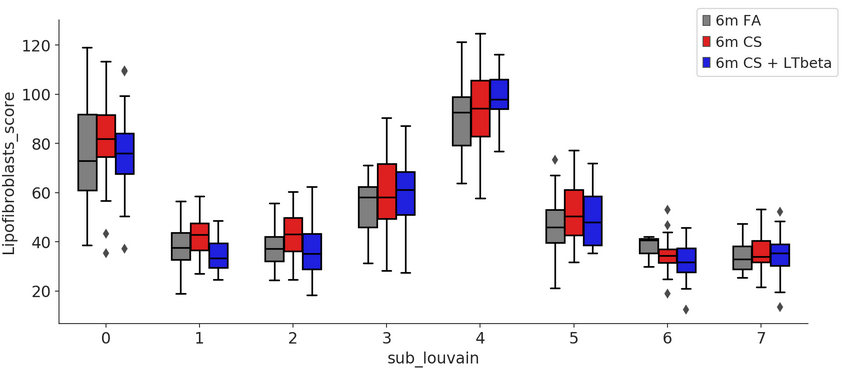
Plot gene values as split boxplots.

Parameters:
  • table – Pandas DataFrame

  • palette (List[str]) –

  • xlabel (str) – x-axis label

  • hue (Optional[str]) –

  • figsize (Tuple[int, int]) – Size of the figure as specified in matplotlib

  • legend – Whether to draw a legend or not

  • score

  • scatter

  • rotate

  • width – Width of the desired plot

  • save – Path to save the plot to

Example

../../_images/gene_boxplot.png