sc_toolbox.plot.relative_frequencies_boxplots#
- sc_toolbox.plot.relative_frequencies_boxplots(relative_frequencies, cluster, cols, order, xlabel='days', hue='batch', figsize=(15, 6), width=0.5, jitter=None, save=None)[source]#
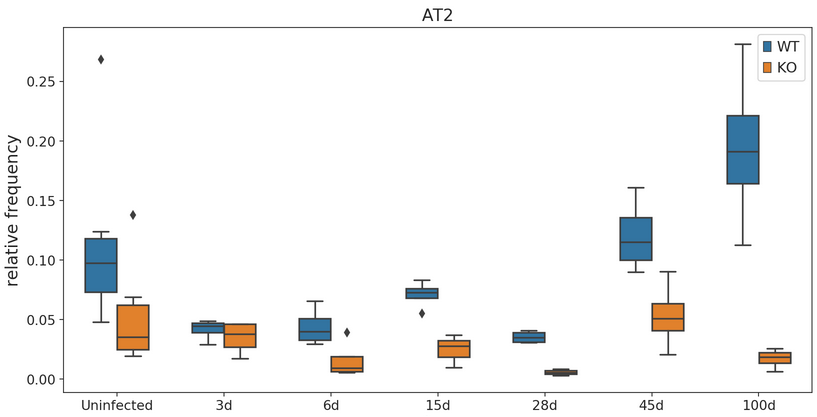
Plots the relative frequencies as split boxplots.
Use calc_relative_frequencies to get the required input format.
- Parameters:
relative_frequencies (
DataFrame) – Calculated by calc_relative_frequencies as Pandas DataFramecluster – Cluster to be plotted
cols – List of colors to use for boxes
order – Order of x-axis labels from left to right
xlabel (
str) – x-axis labelhue (
str) – Value to color byfigsize (
Tuple[int,int]) – Size of the figure as specified in matplotlibwidth (
float) – Width of the plot as specified in matplotlibjitter – Set to True for individual dots per sample
save – Path to save the plot to
- Return type:
Example