sc_toolbox.plot.gene_expression_dpt_ordered#
- sc_toolbox.plot.gene_expression_dpt_ordered(data, genes, xlabel, order=3, conf_int=95, figsize=(12, 6), condition=None, label_size=15, cols=None, scale=None, ylim=None, save=None)[source]#
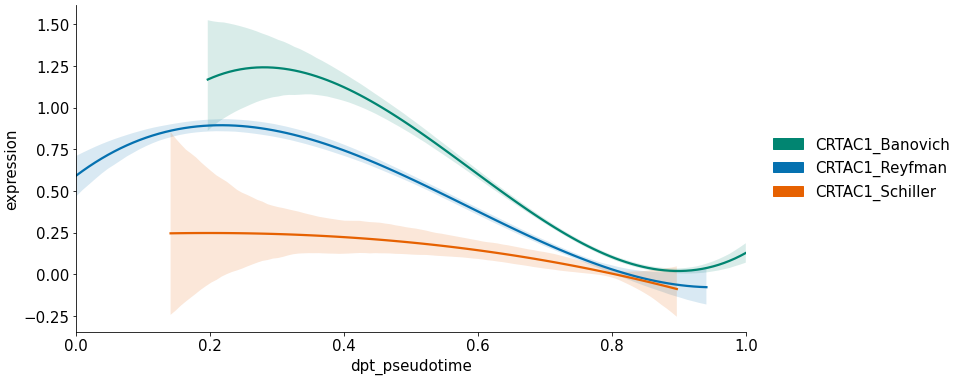
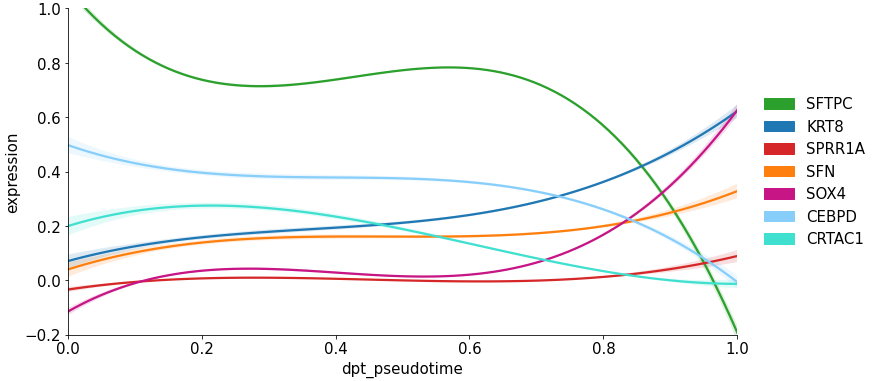
Plot smoothed expression of all cells ordered by pseudo time.
- Parameters:
data – AnnData object
genes – List of genes for which individual line plots will be generated
xlabel – x-axis label
order – Order of x-axis labels from left to right
conf_int – Size of the confidence interval for the regression estimate
figsize (
Tuple[int,int]) – Size of the figure as specified in matplotlibcondition – Split expression values by this grouping, one line per category will be drawn
label_size (
int) – Size of the labels as specified in matplotlibcols – List of colors to use for line plot
scale – Set to True to scale expression value to a range between 0 and 1
ylim – Upper limit on the y-axis if desired
Example
- Example with columns: