sc_toolbox.plot.volcano_plot#
- sc_toolbox.plot.volcano_plot(table, fdr_thresh=None, log_fc_thresh=0, adj_p_val='adj_p_val', log_fc='avg_logFC', gene='gene', sig_col='tab:orange', col='tab:blue', figsize=(8, 6), save=None)[source]#
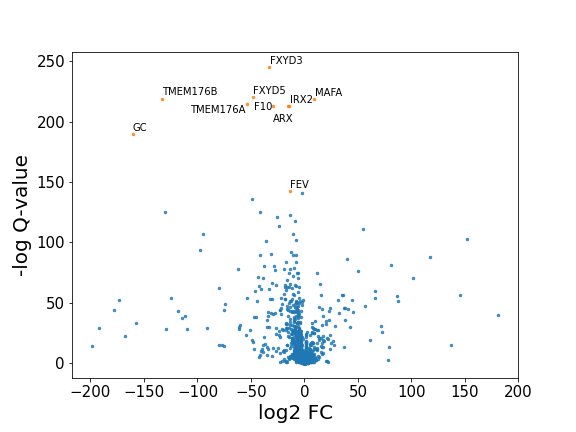
Scatter plot of differential gene expression results generated by diffxpy
- Parameters:
table – diffxpy generated table of results
fdr_thresh (
Optional[float]) – -log(FDR) threshold for labeling genes. If set to None, we will consider the 99th percentile of -log(FDR) values the threshold.log_fc_thresh (
float) – absolute(log_fc) threshold for labeling genes.adj_p_val (
str) – Label of the adjusted p value, these are considered FDRslog_fc (
str) – Label of the log fold changegene (
str) – Label of column with gene namescol (
str) – Color of dotssig_col (
str) – Colour of dots surpassing defined FDR thresholdfigsize (
Tuple[int,int]) – Size of the figure as specified in matplotlibsave – Path to save the plot to
Example