sc_toolbox.plot.genotype_vs_genotype_umaps#
- sc_toolbox.plot.genotype_vs_genotype_umaps(adata, genotype_key, genotype_label_1, genotype_label_2, color, hide_one_legend=True, figsize=(12, 6))[source]#
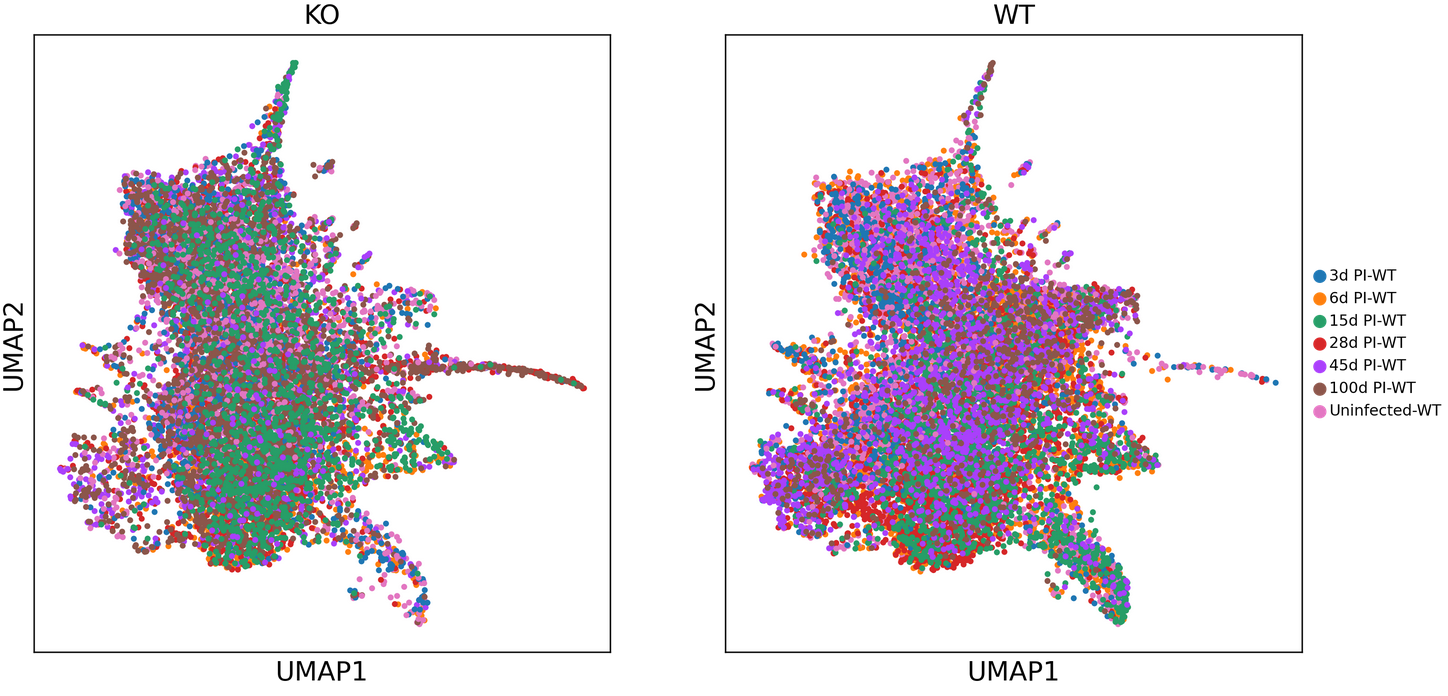
Plots a two UMAPs of genotypes next to each other displaying only the colors of the second UMAP.
- Parameters:
adata – AnnData object
genotype_key (
str) – Key of the genotypesgenotype_label_1 (
str) – Name of the first genotype; Must be contained in the genotypesgenotype_label_2 (
str) – Name of the second genotype; Must be contained in the genotypescolor (
str) – Key to color byhide_one_legend (
bool) – Whether to hide the legend of the genotype_label_1
Example